
Home Annual Report Licensing Exams Repeaters Goggle Groups Membership
Directions Downloads/Links By-laws About Contact
----------------------------------------------------------------------------------------------------------------------------------------------------------------------------------------------
 J/S WB1GRB 1/5/2019
Fred Cunningham's (K1FC) Feedline Analysis
Program, SWRPLOT
Download
plotswr.exe
Antenna Data
SWRPLOT uses data from an antenna modeling
program such as MMANA to analyze the input impedance to a feedline across a
frequency band. The modeling program is used to calculate the antenna input
impedance for the top and bottom frequencies. Data for up to 10 bands can be
entered. The program assumes a linear interpolation of the impedances. This
may not work for some bands and those bands must be split.
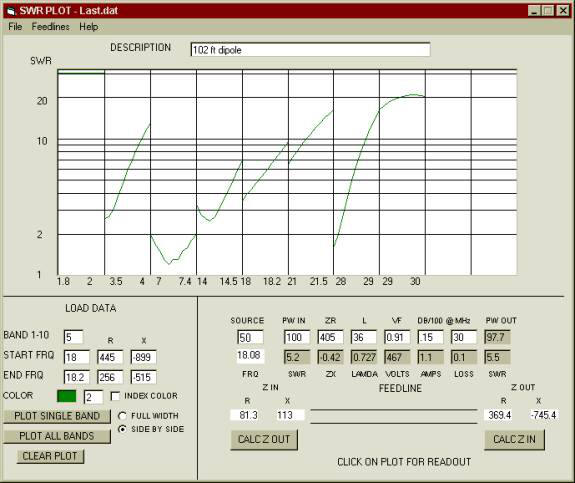
Plotting
SWR
The
SWR will be plotted in the color selected. The plot color can be changed by
changing the number in the box (0 to 14). If the INDEX COLOR box is checked,
the color will increment after each calculation. This is to make it easy to
spot changes or distinguish bands if all bands are plotted Full Width. You
may also plot all the bands side by side. Delete the plots with Clear.
Numerical
Readout
You can get a numerical readout by clicking on the
plot. In addition to the frequency and SWR it will display the power out and
the maximum voltage and current for a given power in. SWR OUT is the SWR at
the load and SWR IN is the SWR from a specified source. Note that clicking
recalculates the band selected.
Printing and Saving
The Plot may be
printed with File/Print. If you exit by File/Exit the last data is saved in
the file "last.dat." This data is restored on program start. Sets of data
can be saved with an appropriate file name. Typing in ".dat" is optional
when saving.
Downloads / Links
-
Best Ham Radio for Beginners 2019 – Reviews and Buyer’s Guide
-
The Best Amateur Radio Links of 2018
-
The Best Amateur Radio Links of 2017
-
Best Mobile Ham Radios 2019 – Reviews and Buyer’s Guide
It is possible to calculate the output impedance from measurements of input impedance by entering the data including the frequency and clicking CALC Z OUT or to calculate a single point by entering the load data and clicking CALC Z IN.
Feedline Data
The feedline length is in feet. The velocity factor is in the form ".XXX" and the loss is in db/100 feet at a given frequency. Use the frequency datum closest in ratio to the frequency of interest. There are feedline data for some common coax and parallel lines. The user can add data to Linedata.txt for coax lines and LinedataP.txt for parallel lines. The feedline reactance and wavelength are calculated by the program.
Feedline properties can be found in the ARRL Antenna book and various online sources. Try to get information on the brand and type to be used. Some brands can vary from batch to batch.